See every row. Know every plant.
CropVista maps rows, plants, diagnostics, treatments, seasonal history, and harvest readiness to GPS-aware plant records.
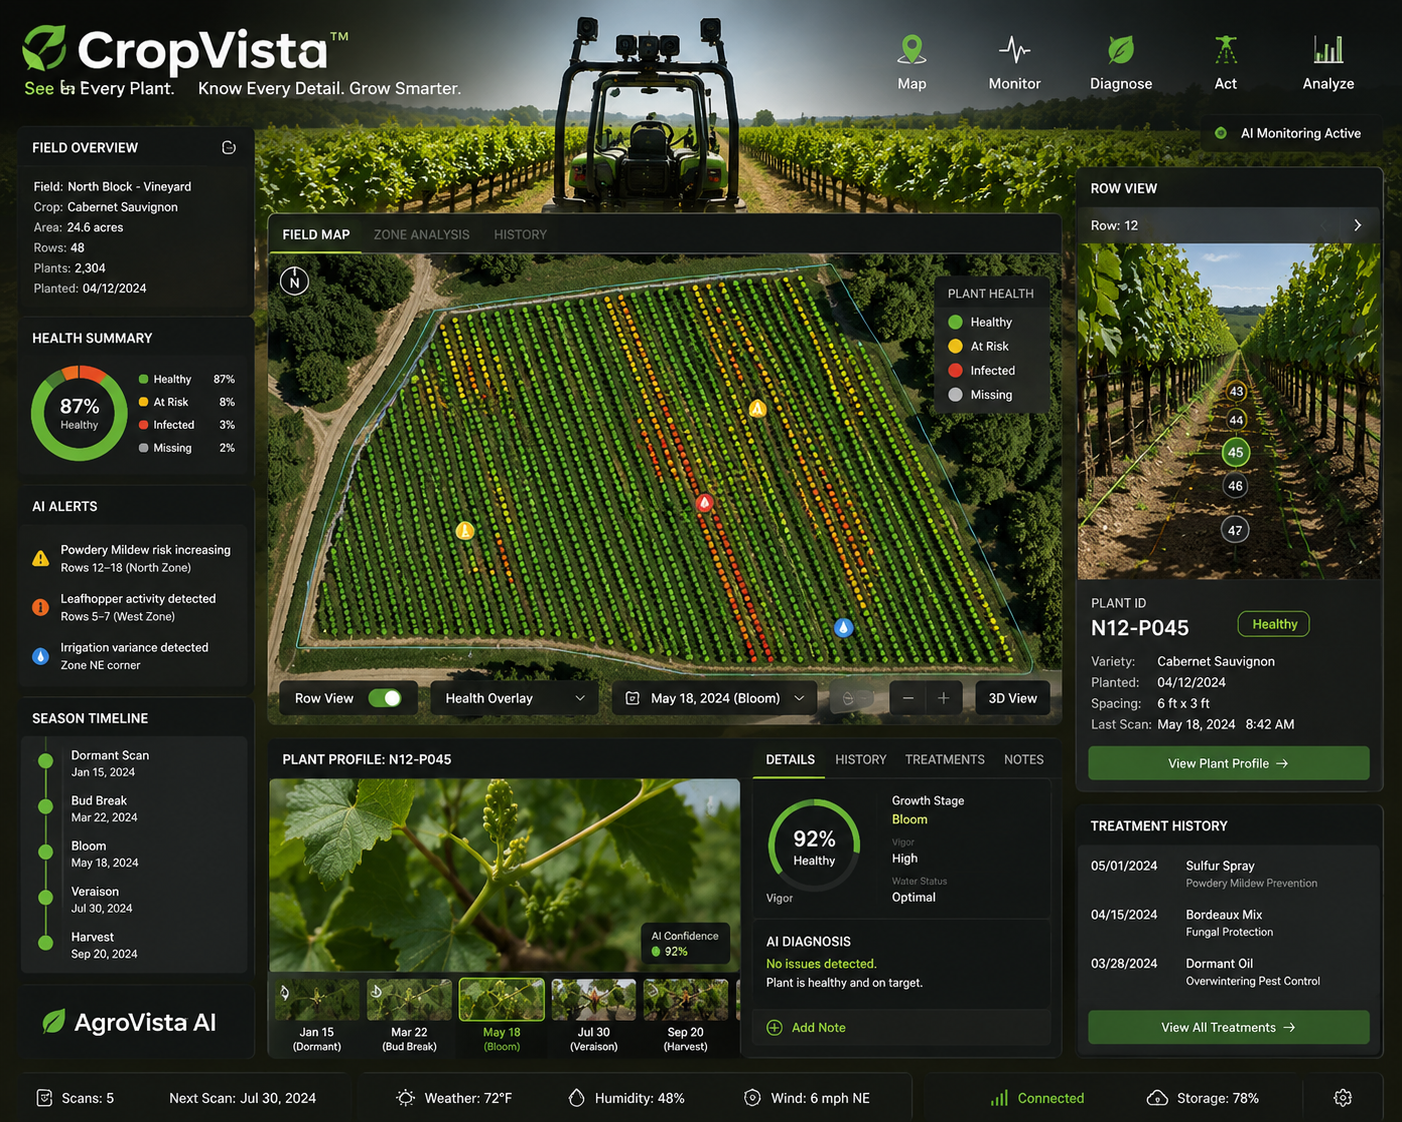
From field map to individual plant record.
Field
Boundary, acreage, block name, crop, variety, weather zone, irrigation zone, soil profile, and treatment zones.
Row
Row number, row direction, spacing, bed width, trellis type, slope, vigor trend, and pass history.
Plant ID
Example: FIELD-A-R12-P045. Each plant can hold photos, health score, diagnosis, treatment, yield notes, and replacement status.
Season History
Dormant, bud break, bloom, fruit set, harvest, post-harvest, and multi-year comparisons.
CropVista imaging belongs on the chassis, not one tank module.
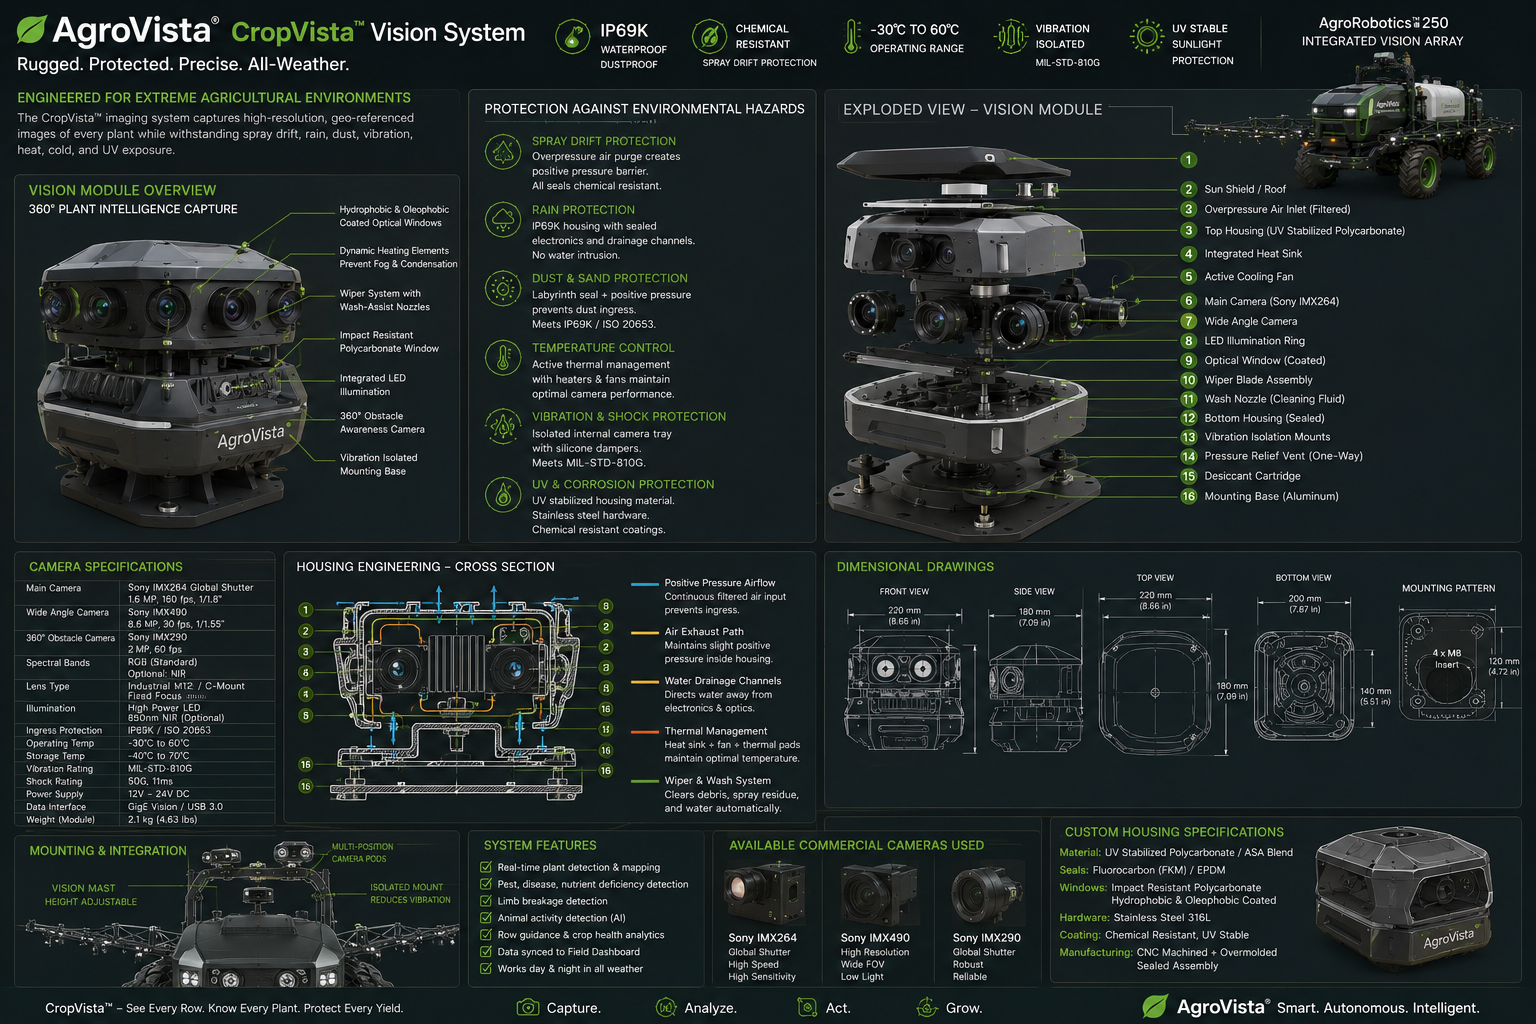
Protected Vision System
Cameras, LiDAR, night vision, thermal/photometric sensing, IMU/GPS/RTK, and onboard compute remain with the Robotics-250 base chassis so every module benefits from the same intelligence.
Works Across Modules
Sprayer, grape harvester, hedge/leaf module, pouch prune, mower, weed tool, imagery scout, and future implements all use the same map, AI, and field memory.